This news item expired on Monday, December 31, 2018 so the information below could be outdated or incorrect.

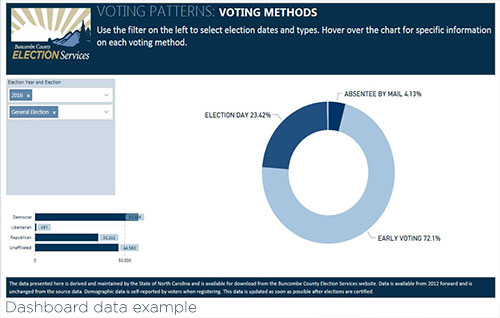
Have you ever wondered whether more male or female voters turned out in the last election? Or what the age break down was in 2016? Maybe you have been curious how party affiliation was distributed over your precinct for the last five elections. Answers are now at your fingertips! Buncombe County Election Services has created a set of election data dashboards to give users an accessible way to sort and view election information such as age & gender, race & ethnicity, party affiliation, and voting patterns. These dashboards are available on the Election Services website.
Every year is an election year. Accessible election data enhances the inclusiveness, transparency, and accountability of the election process. The election data dashboards are great tools for learning about the local electorate and the election cycle. Most information is available at the precinct level. A user is able to select by date and election type to view information on one election at a time or compile statistics for multiple elections with just a few clicks. Maps and bar charts are interactive, allowing users to drill down to information as specific as they wish.
The Election Services dashboards are a collaborative project between the Buncombe County Board of Elections and Buncombe County’s Performance Management Team, created to deliver NC State Board of Elections data in a way that promotes greater exploration, interactivity, and insights for the Buncombe County electorate.